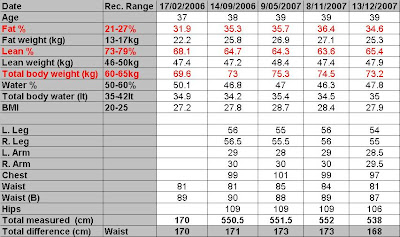

I will be having my measurements done every month. I have this done at the gym (more about the gym later). I hope you can see what is going on in the graph above. I have recorded my body fat and lean mass from Feb 2006. There are 5 measurements at various dates.
In the graph the top pink line is my percentage lean weight ie the percentage of my total weight which is not fat. The bottom line is the percentage of my total weight which is fat. The idea is to get these lines to move away from each other. We need to increase the lean weight and decrease the fat weight.
In the graph the top pink line is my percentage lean weight ie the percentage of my total weight which is not fat. The bottom line is the percentage of my total weight which is fat. The idea is to get these lines to move away from each other. We need to increase the lean weight and decrease the fat weight.
My first total weight measurement in Feb 2006 was 69.6kg. This jumped up to 73kg in September 2006. I am afraid I am a comfort eater and 2006 was not a good year for me. By May 2007 I was 75.3kg. By Nov I had dropped down to 74.5. Then started a major drive to get rid of this weight. By 13 Dec I weighed 73.2kg.
Now for me to get to my target weight of 62kg by mid April I have to lose almost 1kg a week. This ain't gonna be easy and I did not make a good start this year. BUT I did not pick up too much weight over the festive season so I can say that I have got rid of at least 1.5kg.
Now for me to get to my target weight of 62kg by mid April I have to lose almost 1kg a week. This ain't gonna be easy and I did not make a good start this year. BUT I did not pick up too much weight over the festive season so I can say that I have got rid of at least 1.5kg.

No comments:
Post a Comment